Background
The month of March 2021 marked a year since several countries either reported their first cases or instituted lockdowns due to COVID-19. In that time, over one thousand seven hundred (1700) deployments have been set up on Ushahidi’s platform to track and gather information on various aspects of the pandemic. As the vaccines roll out in multiple countries, we thought it prudent to begin to take stock and engage with some of our deployers in a bid to gauge user experiences and what impact, if any, their pandemic-related deployments have had in their local communities.
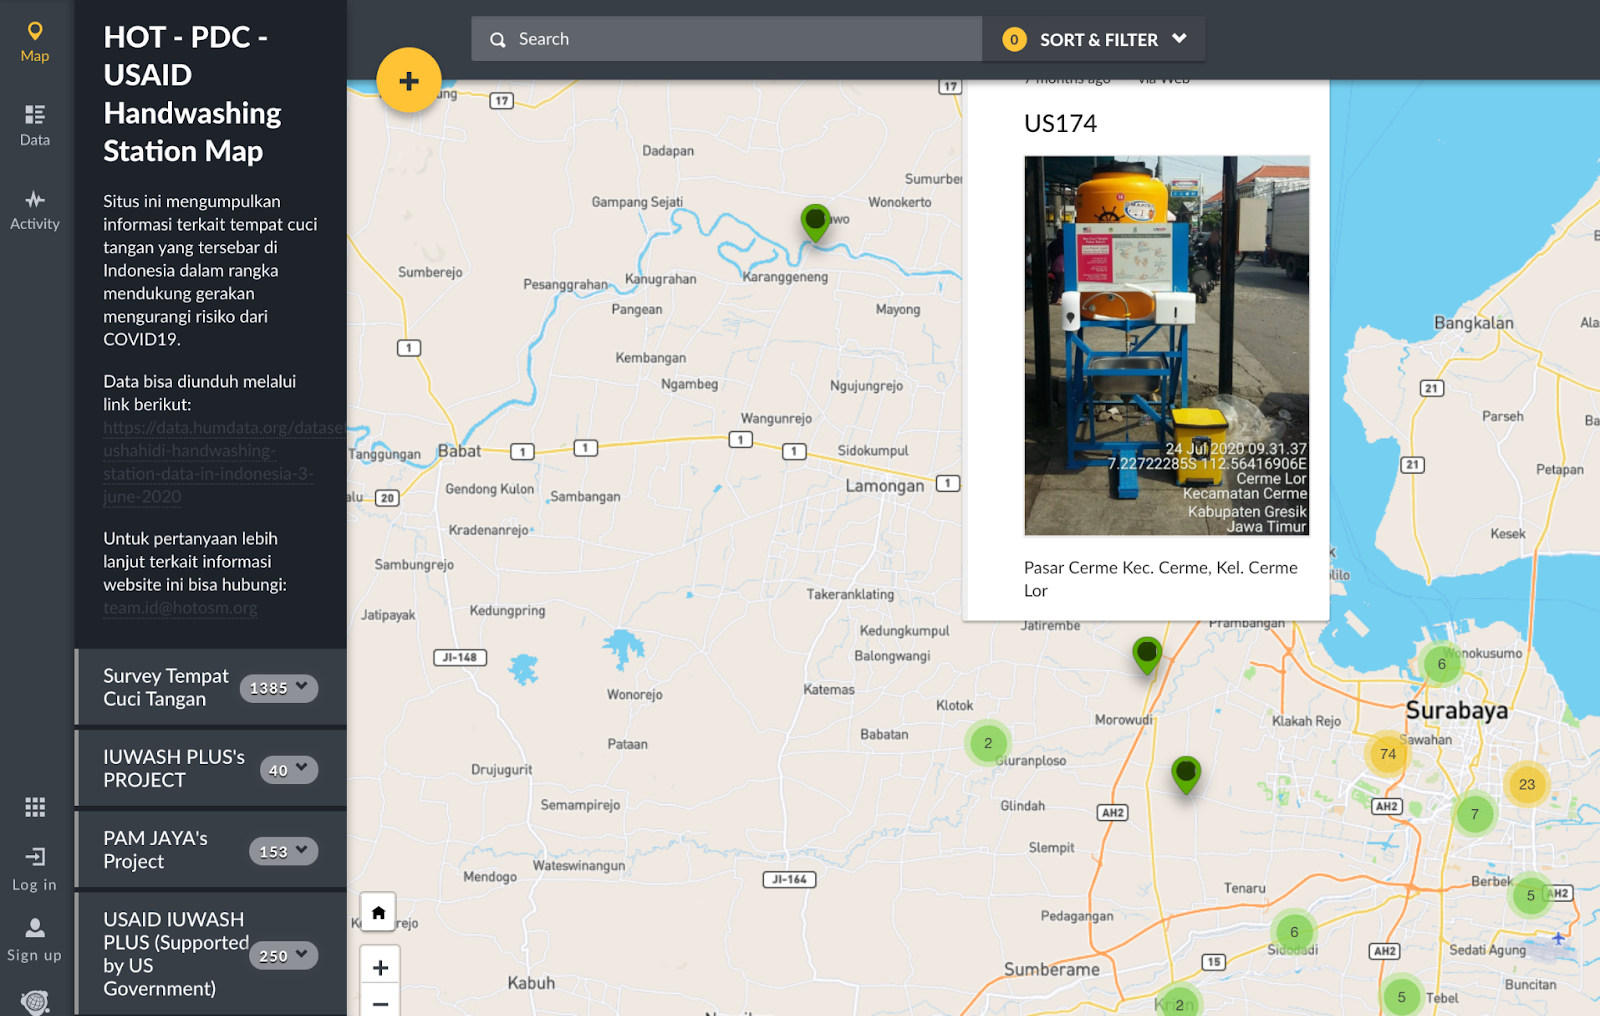
One such engagement was with Harry Machmud from Humanitarian Open Street Maps (HOT) in Indonesia. They set up a deployment to track handwashing in May 2020 that has had over 2100 posts as of 22nd March 2021. The idea was inspired by early expert advice deeming handwashing as an effective way to prevent the spread of the virus. They, therefore, decided to publicize handwashing station locations to allow easier access for the people. The project was initiated by Pacific Disaster Center (PDC) and USAID, their partners in Indonesia, who needed a map showing these locations. Furthermore, their collaboration with PDC was also designed to provide data to their disaster management platform called InAWARE used by the National Disaster Management Agency for disaster management monitoring.
Due to HOT’s experience using the Ushahidi platform and the need for public participation, the deployment was set up, with their target audience being the general public. When COVID hit, individuals and local communities separately had the initiative to install handwashing stations. The HOT deployment hoped to boost those efforts and continues to seek opportunities to scale up this project’s reach and impact.
Despite handwashing being a well-known mitigator of the spread of covid 19, people in Indonesia, for the most part, didn’t know how easily they could access the handwashing stations due to a lack of knowledge of their existence. Simultaneously, regular washing of hands is not a habit embraced by many people, even before COVID, which is one of the major causes of quickly spreading the virus, having the stations brought awareness to the people. These are some of the problems that HOT sought to address through this project.
Usability and Features
To attract entries onto their deployment, HOT employed several strategies such as:
- Social media campaigns to create awareness about the deployment
- Promoting engagement by providing regular statistics on reports received
- Publishing short videos to ease public participation
- Publishing testimonials from people who used their deployment to submit reports.
Because different organizations owned some of the data uploaded, HOT had to obtain the necessary authorization to make their data public. This type of information was provided via CSV files for easy data exchange, which was later uploaded onto their platform, filtered, and finally made public for consumption as they saw fit.
The process that was used to obtain the data from the deployment was as follows:
- The data was regularly exported as a CSV file (because the platform allows this) and transferred into their HDX (Humanitarian Data Exchange) website to make it accessible to people who wanted to use it for analysis.
- Integrated reports from the deployment into PDC’s InAWARE server served as additional information to the government, especially the disaster management agency, to improve knowledge on how people were preventing the spread of the virus.
The most helpful aspect of the Ushahidi platform, HOT felt, was its capability of exporting data via CSV. People not only want to see the data but also be able to use it. They felt this greatly aided them in further analyzing the data for confirmation purposes. They also appreciated displaying data in text, image, and video format on the deployment. After previously having used the V2 version of Ushahidi’s platform, V3 being available as a mobile app became very useful to users on the ground.
Impact
- The first and most obvious effect of the deployment was the public’s participation; seeing people’s awareness and appreciation of the deployment and their willingness to help made HOT realize how many people cared and still care about the situation.
- Feedback from the community indicates that this data is used by different projects for analysis in several areas at the local level.
- People have also reached out to HOT via their social media campaigns or directly contacted them, saying that the deployment helped them identify closer handwashing station locations.
- The project has also definitely created awareness around Jakarta, though they cannot yet indicate how it has specifically changed people’s behavior. The impact thus far has largely been making people contemplate the question:
“What’s the value of knowing the locations of these stations? Oh, it’s because I have to wash my hands regularly to avoid the spread of this pandemic.”
Looking Ahead
HOT Indonesia plans on continued monitoring and evaluation using the data collected to convert it into valuable information from its raw data form. This way, any impact in terms of changed behavior will hopefully emerge and be better understood.
To continue supporting HOT on this project, feel free to share these videos;