[Guest Post: John Etherton is the founder and managing partner of Etherton Technologies, Ltd. John is an Ushahidi Trusted Developer. This is a cross-post from his blog.]
 I recently had a client that uses Ushahidi to monitor water wells in Afghanistan ask me about increasing the speed of their site. They currently monitor around 3000 wells, but will soon ramp up the project to monitor all the wells in the country. This would increase the number of wells to 100,000 plus. Preliminary testing showed that the out-of-the-box Ushahidi platform using, our Enhanced Map plugin for map rendering, could not load fast enough to provide an acceptable user experience with this much data. My client wanted to be able to zoom and pan the map, as well as filter by category, as quickly as possible, and with the default setup this was taking as much as several minutes with large sets of data. Below I’ll outlines the steps taken to fix this. I hope this will help others with similar problems.
But first a quick disclaimer: I do realize that 100,000 isn’t really the definition of large in the computer world these days. Some would say you can’t talk about “large data” until you’re talking billions or trillions, but for the Ushahidi community this is uncharted territory, and feels pretty darn big.

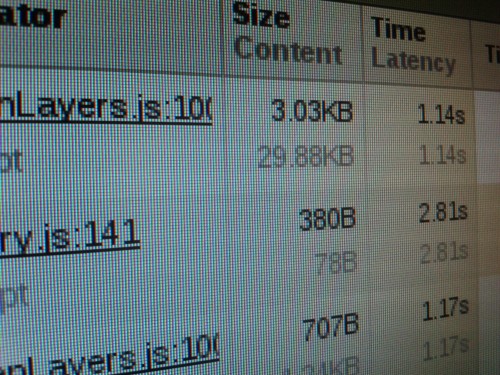
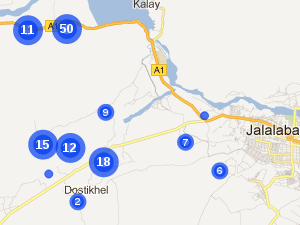
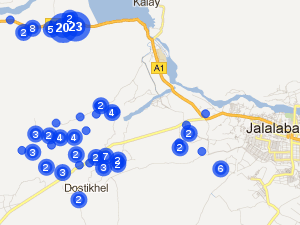
 The next problem I had was that OpenLayers doesn’t work well with 40,000 points. When I tried rendering all 40,000 incidents at once in open layers it took well over 60 seconds for them to render. In addition to making the user wait, long loops in JavaScript freeze the entire browser, making the whole thing unresponsive. This is a big no, no for a good user experience. Whenever a user zooms way into the map, the number of clusters will be very low and the number of individual points very high, and thus the time to render the clusters server side, and the time to render them client side, will become very, very slow.To combat this I rewrote the mapping system, both client and server side, to only send the data for incidents that were near the users current view point once the user had zoomed in past a certain point. That way the system only loads the incidents that the user is looking at, and that it is likely to pan over to. The system was also setup to detect when the user was getting close to panning past the set of data that was gathered and refresh the data at that point.This took the run time of the new downsampling algorithm at zoom level 13 down from 0.6 seconds to 0.1 seconds, and made the client side render very fast (sorry I don’t have real numbers for that speed increase). This implementation also has the added benefit of reducing the number of results from the database each time the user zooms in.
With all the above changes in place, what used to take between 30 seconds and 2 minutes to display on my clients Ushahidi map, now takes between 0.13 seconds and 2 seconds. All in all not bad. I would also like to add that all of this was done with out modifying the core Ushahidi code, just a few plugins.
I’d love any comments, critiques and other feedback on this article.
Thanks,
John.
 I recently had a client that uses Ushahidi to monitor water wells in Afghanistan ask me about increasing the speed of their site. They currently monitor around 3000 wells, but will soon ramp up the project to monitor all the wells in the country. This would increase the number of wells to 100,000 plus. Preliminary testing showed that the out-of-the-box Ushahidi platform using, our Enhanced Map plugin for map rendering, could not load fast enough to provide an acceptable user experience with this much data. My client wanted to be able to zoom and pan the map, as well as filter by category, as quickly as possible, and with the default setup this was taking as much as several minutes with large sets of data. Below I’ll outlines the steps taken to fix this. I hope this will help others with similar problems.
But first a quick disclaimer: I do realize that 100,000 isn’t really the definition of large in the computer world these days. Some would say you can’t talk about “large data” until you’re talking billions or trillions, but for the Ushahidi community this is uncharted territory, and feels pretty darn big.
Define the Problem
The first thing to do is understand what the problem is. The site is password protected for security reasons, so the problem isn’t handling thousands of hits a day. It’s more likely the site will have 10-100 hits a day. The site is used to track broken water wells, but is also used to look for trends in the performance of the wells. Thus users will run simple queries when they need to find which wells aren’t functioning, but they’ll run rather complex queries when they are looking for trends. Things like, “Show me all wells that are in province A, B, or C, and have been repaired in the last 30 days, and that were suffering from a drop in the water table.” Data for the site is uploaded on a regular basis via Excel files. The site doesn’t use crowdsourcing, so it won’t be receiving lots of writes to the database. From this we know that write performance isn’t very important. If it takes 60 seconds to import 2000 new wells from an Excel file instead of 10, that’s not a big deal because this will only happen once a week and the users who execute these operations can be trained to wait. What isn’t acceptable is taking 60 seconds to load the Ushahidi home page, and each subsequent map manipulation. We know that we’re willing to trade write performance for read performance. We can also deduce that caching could help a little bit with the initial loading of the map page, and the lists of wells that need maintenance, but for exploratory queries that are aimed to reveal trends in the data, caching won’t do much good. We’re also not dealing with large numbers of hits, where caching would be a great solution. To solve the problem we’re facing we’ll want to ensure that the database is optimized for quick reads, well indexed, and that the functions and algorithms that Ushahidi uses to render the map are optimized to spit out data. Also for the sake of this article let me make it clear that each well is represented by an Ushahidi “Incident.” For the rest of the article I’ll call them incidents to be general. The Enhanced Map plugin was used to provide more advanced queering on the Ushahidi map than is possible using the default map. With Enhanced Map user can run queries using more than one category and can choose if the results from each category should be joined using a boolean ∧ (and) or a boolean ∨ (or). For example, “I want to see all incidents filed under category A or B or C.” or “I want to see all incidents filed under category X and Y and Z.” Enhanced Map has two versions that accomplish this different ways. The standard version accomplishes this by using the Reports::fetch_incidents() help function, the high performance version uses it’s own SQL to query the database using JOINs instead of nested queries. JOINs are slightly faster than nested queries in Ushahidi. The advantage of the standard version is that it will play nicely with other plugins that modify the filtering of data via the ushahidi_filter.fetch_incidents_set_params event. This project used the high performance version, since performance was most important. Both versions of Enhanced Map use the same clustering algorithms as the /application/controllers/json.php cluster() method. The site uses clustering because thousands of dots are harder to look at and make sense of than clusters, especially when zoomed out to country level. This project uses Ushahidi 2.1. I know a lot has changed since then, but to the best of my knowledge, 2.5 still has the same bottlenecks that I outline, and the principles behind the changes I made should be applicable to any version of Ushahidi to date.Set Some Baselines
These tests were run locally (i.e. I ran everything off of localhost) on a home built machine running Ubuntu 11.10, PHP 5.3.6, and MySQL 5.1 with 24GB of RAM, an Intel i7 950 CPU, and a Seagate Barracuda 1TB hard drive. What can I say, I don’t like running low on memory. Anyway… The next thing I did was setup a test instance of the site to test out the changes I made. I made a copy of the production site and then add extra incidents until there were 40,000 in total. With the extra wells it took around 30 seconds to render the home page map and timeline. I setup another test site with 100,000 incidents, but it took over a minute to load the home page, so I stopped using it because it took too long to test things, and I figured if things ran well at 40,000 incident it would run well at 100,000. As I said earlier the site would be used to run some rather complex queries looking for trends. The query below took 7 seconds to run against the database with 40,000 incidents in phpMyAdmin:SELECT incident.id, location_id, incident_title, incident_date, incident_active, province_cat.id as province_cat, location.latitude as lat, location.longitude as lon FROM `incident` as `incident` LEFT JOIN `location` as `location` ON `location`.id = `incident`.`location_id` LEFT JOIN `incident_category` as `province_incident_cat` ON `province_incident_cat`.incident_id = `incident`.`id` LEFT JOIN `category` as `province_cat` ON `province_cat`.`id` = `province_incident_cat`.`category_id` LEFT JOIN `incident_category` as `cat0` ON `cat0`.incident_id = `incident`.`id` LEFT JOIN `incident_category` as `cat1` ON `cat1`.incident_id = `incident`.`id` WHERE incident.incident_active = 1 AND incident.incident_date >= '2010-03-01 00:00:00' AND incident.incident_date <= '2012-08-31 23:59:59' AND `province_cat`.`parent_id` = 5 AND ( ( cat0.category_id = 6 OR cat0.category_id = 7 OR cat0.category_id = 14 ) AND ( cat1.category_id = 83 ) ) GROUP BY `incident`.`id`The fact that it took so long to run in the database showed us that the database itself had some issue. However, the 7 seconds in the database didn’t account for the 30+ seconds it took for the page to render. So, we know that the clustering algorithm and other Enhanced Map/Ushahidi/Kohana/PHP components are slow.
The Database
The first problem is the lack of indexes in Ushahidi’s database. Given how cheap hard drives and memory are these days, the only reason to not use indexes on every field that you’ll see in a WHERE clause is if the time it takes to update an index on an insert is too slow. This would be a problem if you had lots of inserting going on. Which, as discussed above, is not a problem for this site. I added the following index based on what I knew the site would search on: category- parent_id – If you want to quickly search based on a parent category form_response
- incident_id – I’m pretty sure these two made the biggest difference for the query I showed above.
- category_id
- latitude - Obviously you want these two fields to be searched quickly
- longitude
- Merge the location and incident tables. There’s one location per incident, so there’s no reason to have the locations in a separate table. Having a separate table just creates an unnecessary join when looking up incidents.
- Pull non-essential fields out of the incident table, especially large ones. Since MySQL 5.5 and InnoDB tables can be loaded into memory for super fast performance you want your tables to be small. Thus I’d suggest removing the incident_description field into a separate table. It’s been my experience that users rarely search over the description and as a LONGTEXT field it can take up a lot of space. However, if your site does require frequent searching on the incident_description field this may not be for you.