 Two weeks ago we launched CrisisNET, and with it the CrisisNET blog, where we post analyses using conflict and disaster data, along with tutorials for new data journalists and data scientists. In case you don't subscribe to the blog or follow CrisisNET on Twitter, here's what you missed:
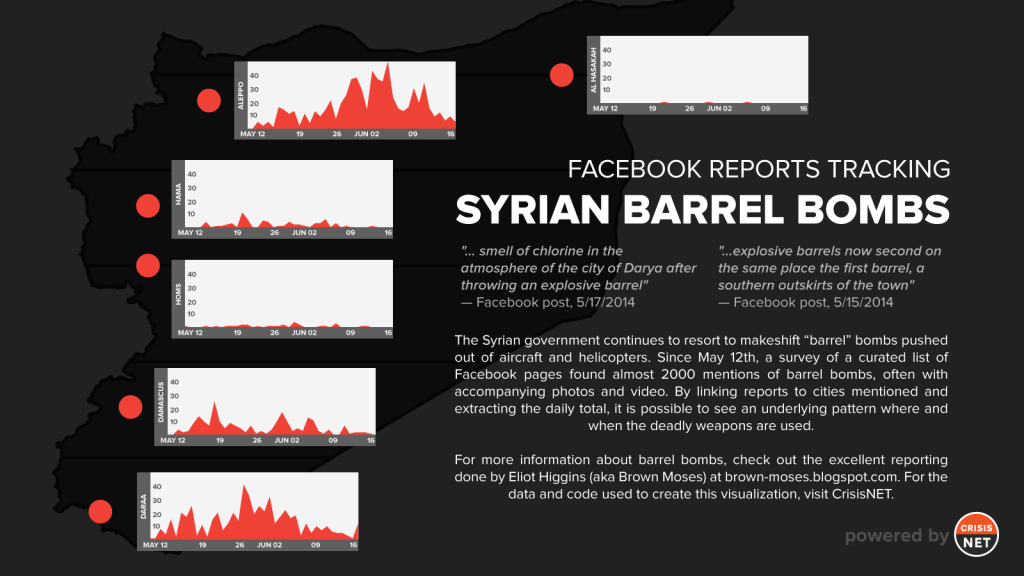
Tracking Syrian Barrel Bombs
Barrel bombs are improvised explosive devices often used to disperse chemical weapons. Using reports from Facebook we track barrel bomb attacks across Syria. [Link]
Who Helps During a Disaster?
Calls for volunteers are four times more common than requests for money. See what else we learned about disaster response by analyzing Twitter data. [Link]
ISIS Social Media Timeline
We tracked ISIS on Facebook and Twitter during their recent surge in Iraq. [Link]
Choropleth Maps with D3
Follow this tutorial to generate the popular choropleth visualization using JavaScript and the D3 library. [Link]
Sentiment Analysis with Python
Learn how to calculate whether text is positive or negative using Python. [Link]