The Ushahidi platform provides you with modes to not only visualise your data in different ways, but to also manage it.
We designed “modes” for the discrete and specific actions users need to take within the platform, in a bid to make the platform to be more intuitive and action-oriented for different user types on a deployment.
Ordinary viewers of a deployment can access three different modes as shown below:-
Map
Data
Activity
Signed in users(with the necessary permissions) can access four different modes as shown below:-
Map
Data
Activity
Settings
Your ushahidi deployment defaults to the map mode for anyone who visits your homepage(as illustrated above). To change your current mode, select any of the options provided to you from the menu on your left.
Map Mode
This mode displays all published posts on a map.
Each post appears as an icon on the map. In the event that you opted to combine nearby posts on your Map settings page (General Settings section of this manual), posts adjacent to each other on the map will cluster together, displaying a number denoting number of posts combined.
Clicking on each individual post displays a small pop up box with the post title and description.
You should also be able to zoom in and out of the map as desired.
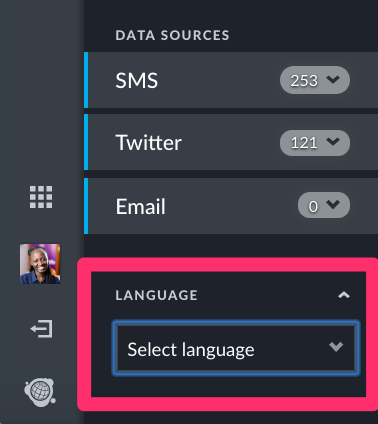
You also get a breakdown of incoming posts by source, as shown below.
Visitors to your ushahidi instance can also select the language they'd like to interact with your data in. The language list consists of languages that have been translated upto 80%
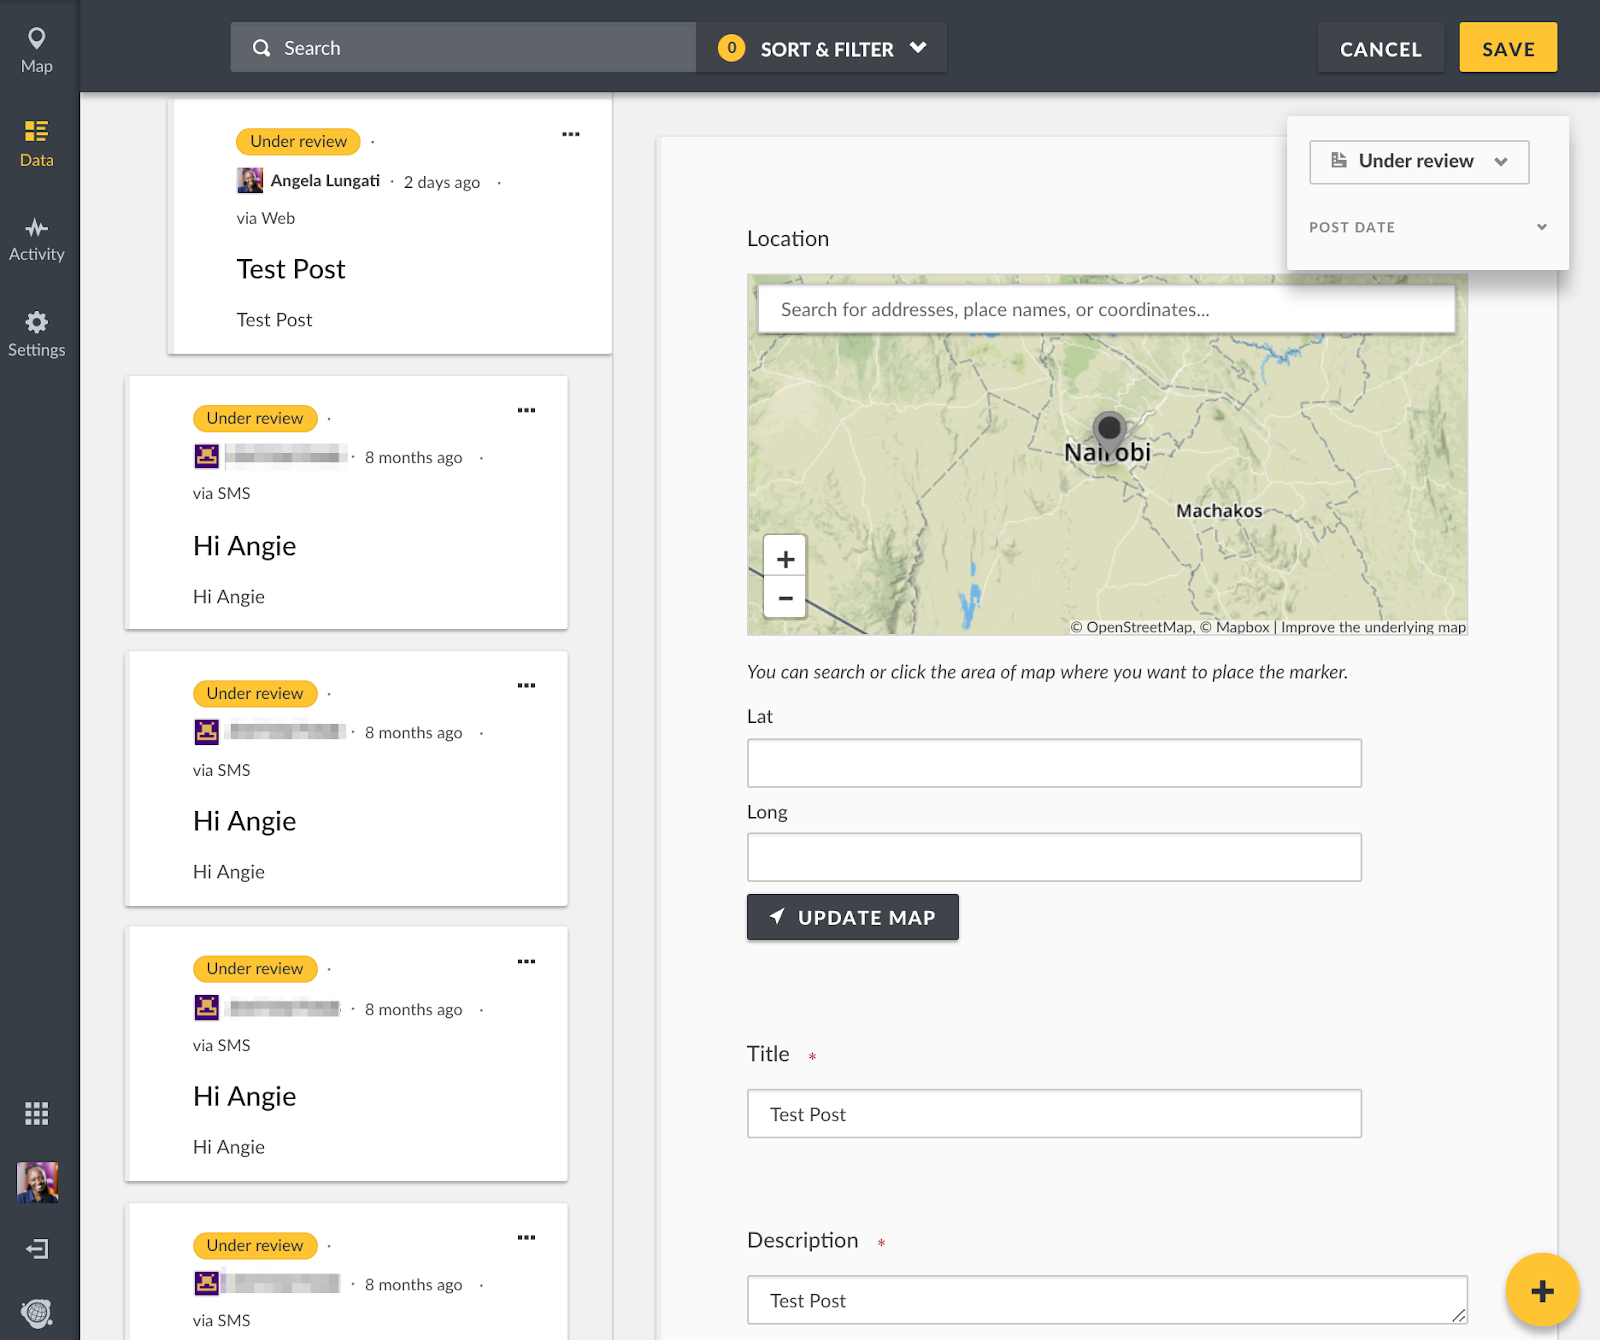
Data Mode
This mode allows you to view, triage, and manage posts coming into your deployment as a chronological list of events over time. It provides a split pane that allows for viewing post summaries on the left pane, and post details and editing in the right.
From here, you should be able to:-
Add new posts
View individual post details
Edit posts to either change existing structures or assign posts from Twitter, SMS and/or email to a survey
You can also
Add posts to collections
Publish posts
Put posts under review
Archive posts
Share posts
Delete posts
Get notified when new posts arrive
Perform bulk actions( publishing, putting under review, archiving, adding to collections and deleting) on multiple posts at a time
NB: Data displayed on this page is dependent on permissions granted to the user viewing this page
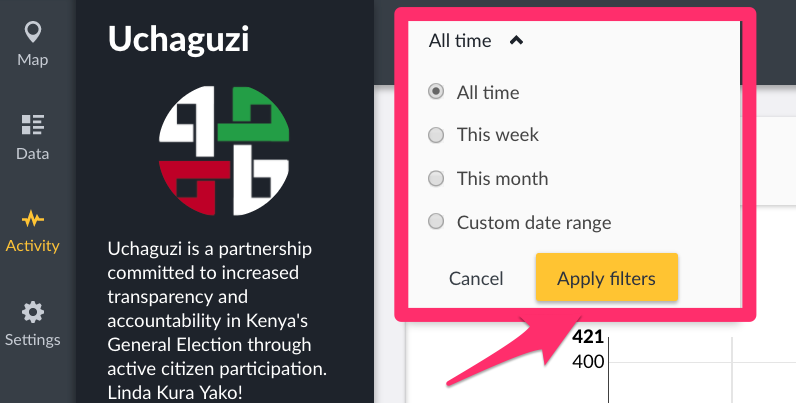
Activity Mode
This mode gives you a summary of how people are interacting with your deployment over time.
You can compare
Activity over time
You can filter post count in a line chart over time by:-
All posts
Categories that the posts belong to
Surveys that the posts were submitted to
Status i.e whether they’re published or not
You can opt to view your post counts on the graph as cumulative totals.
Activity by Volume
You can filter post count in a bar chart over time by:-